
Each machine learning problem poses the question of evaluating the model results.
Without the introduced criteria, it is impossible both to assess the success of the model, and to compare two different algorithms with each other. That is why it is important to take the correct choice of metrics for the task at hand into account, although many existing metrics can be confusing and, ultimately, lead to a sub-optimal solution.
Despite the popularity of machine learning, in many of its areas there is still no unified theoretical concept. The area under consideration is no exception. Although there are several general guidelines for using metrics for some tasks, the final decision is the responsibility of the analyst.
Binary Classification
It is worth starting your acquaintance with this fundamental section by examining methods of evaluating one of the most popular problem formulations: binary classification. In this case, the data is divided into two classes. The labels are usually designated as "+" and "-". Considered metrics are based on the use of the following outcomes: true positive (TP), true negative (TN), false positive (FP), and false negative (FN). For clarity, it can be converted to a contingency table (Figure 1). False positive and false negative outcomes are called errors of the first and second type, respectively.
Take, for example, the task of identifying suspected case of a certain disease. If the patient has the disease, the class is positive. If not, it is negative. Identification whether a patient has a certain suspected disease can be the result of the model's operation. If a patient has a disease, then the result is true, if not, the result is false.
Let some set of medical data be typical of a given diagnosis. If our model identified it correctly and assigned a positive class to it, then this is a true positive outcome. However, if the model puts a negative class label on this dataset, then this is a false negative outcome. If a patient does not have this disease, and the model classifies the record as a positive class, then we are talking about a false positive outcome (the model found the diagnosis, but in fact there is none), and vice versa, if the model defines the record as a negative class, then it is a true negative outcome.
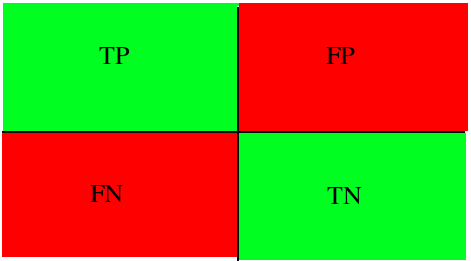 Figure 1: Contingency table for binary classification
Accuracy
One of the simplest and therefore common metrics is accuracy. It shows the number of correctly assigned class labels (true positive and true negative) of the total amount of data and is calculated as follows (Evaluation: from precision, recall and F-measure to ROC, informedness, markedness and correlation):
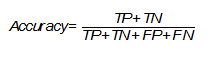
However, the simplicity of this metric is also the reason why it is often criticized and why it may absolutely not fit the problem that is being solved. It does not take into account the ratio of false positives of the model, which can be critical, especially in the medical field, when the task is to recognize all true cases of the diagnosis.
Let's go back to the suspected disease example. If our accuracy is 80%, then we can say that on average out of 100 people it will correctly determine the presence or absence of a diagnosis in only 80 people, while another 20 will be either false negative or false positive.
It is worth paying attention to the fact that in some tasks it is necessary to determine all patients with a diagnosis and even neglect false positive outcomes, since they can be eliminated at the next stages of the study (for example, after the control test), then it is necessary to add another one to this metric, which could assess the required priority.
Precision
Precision shows the number of truly positive outcomes from the entire set of positive labels and is calculated using the following formula (Evaluation: from precision, recall and F-measure to ROC, informedness, markedness and correlation):
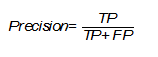
The importance of this metric is determined by how high the cost of a false positive result is for the problem under consideration. If, for example, the costs of further testing the presence of a disease in a patient are high and we simply cannot check all false positive results, then it is worth maximizing this metric, because with Precision = 50% from 100 positively defined patients, only 50 will have a diagnosis.
Recall (true positive rate)
This metric assess the number of true positives among all class labels that were determined to be positive and is calculated using the following formula (The relationship between Precision-Recall and ROC curves):
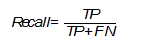
It is necessary to pay special attention to this metric when the error of non-recognition of the positive class in the task at hand is high, for example, when diagnosing a fatal disease.
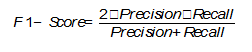
F1-Score
In the event of Precision and Recall being equally significant, you can use their harmonic mean to obtain an estimate of the results (On extending f-measure and g-mean metrics to multi-class problems):
In addition to point estimates, there are a number of graphical methods that can assess the quality of a classification.
ROC
ROC (receiver operating characteristic) is a graph which shows the dependence of correctly classified objects of a positive class on falsely positively classified objects of a negative class. In other words, it is the ratio of True Positive Rate (Recall) to False Positive Rate (Figure 2). In this case, False Positive Rate (FPR) is calculated using the following formula (Evaluation: from precision, recall and F-measure to ROC, informedness, markedness and correlation):
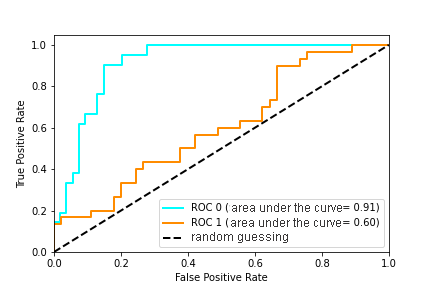 Figure 2: ROC curve
Figure 2 contains an example of two ROC curves. The ideal graph value is at the top left point (TPR = 1, a FPR = 0). At the same time, the curve corresponding to FPR = TPR is a random guessing, and if the graph of the curve of the model or the point is below this minimum, then this only indicates that it is better to flip a coin than to use this model. It is said that the X curve dominates over Y curve if X is at any point to the left and above Y [Using AUC and accuracy in evaluating learning algorithms], which means the superiority of the first classifier over the second.
Using the ROC-curve, one can compare the models, as well as their parameters to find the most optimal (in terms of TPR and FPR) combination. In this case, it is necessary to look at the ratio between the number of patients whose label was correctly identified as positive and the number of patients whose label was incorrectly identified as positive.
AUC (Area Under Curve)
As a numerical estimate of the ROC curve, usually the area under this curve is taken. If X curve dominates over Y curve, then AUC (X)> AUC (Y), the opposite is not always true. However, the AUC has a statistical meaning as well: it shows the likelihood that a randomly chosen instance of a negative class is less likely to be recognized as a positive class than a randomly chosen positive class (Using AUC and accuracy in evaluating learning algorithms):
The AUC is often compared to the Accuracy metric, and the AUC has a clear advantage when examining some models as it can work with probabilities. For example, in “AUC: a better measure than accuracy in comparing learning algorithms”, the following example is shown (Figure 3): Let two models classify 10 test instances. 5 are classified as a positive class and 5 as negative, the instances are ordered according to the probability of belonging to the positive class (from left to right). Both classifiers have the same accuracy of 80%, but the AUC of the first one is 0.96, and AUC of the the second is 0.64, since the probabilities of the wrong instances are different. However, you can find a counterexample, when the AUC is the same, but the accuracy is different (AUC: a better measure than accuracy in comparing learning algorithms):
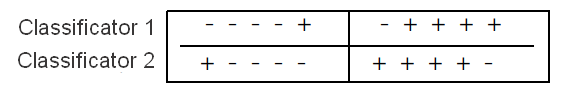 Figure 3: Two classifiers have the same accuracy but different AUC
Multiclass Classification
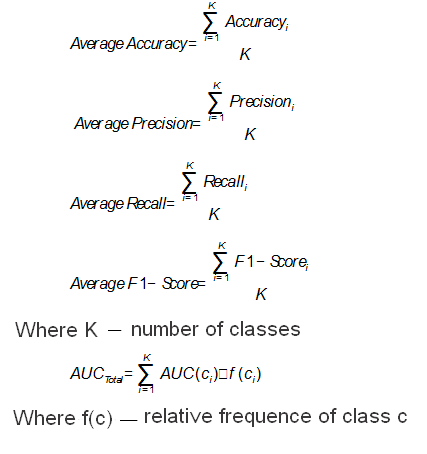
All the metrics considered above related to a binary problem only, however often there are more than two classes. This makes it necessary to generalize the considered metrics. One possible way is to calculate the average metrics for all classes (On extending f-measure and g-mean metrics to multi-class problems). Then the computed class is taken as the "positive" class, and all the others are taken as the "negative" one.
In this case, the formulas for the metrics will look like this:
Application in predictive analytics for healthcare
Theory should always be supported by practice. In this case, you can consider the application of certain metrics for real problems associated with the use of machine learning models in healthcare. In most cases, it is recommended to use the AUC and F-Score metrics because they include a wide list of possible outcomes and, as noted earlier, the AUC is superior to the Accuracy metric, but this is still debated.
The main task of predictive analytics for healthcare is to predict various events. This issue has been well researched for various diseases and use cases; therefore there are many possible methods for solving it. This type of problem is assessed by all the considered metrics for classification, but Accuracy can be noticed to be used more often than others due to its simplicity. For instance, in Disease prediction by machine learning over big data from healthcare communities, the authors analyze medical records in order to predict the possibility of any disease occurrence and they get it 70% for Accuracy, Precision, Recall and F1. In Intelligent heart disease prediction system using data mining techniques and Heart disease prediction system using naive Bayes, the Accuracy metric reaches approximately 90-95%, but this is affected by the size of the dataset that was used for the study.
Among the entire list of diseases, cardiovascular diseases (CVD) are of particular relevance. A lot of research on CVD prediction demonstrates what can be achieved in this area thanks to machine learning. It often uses the AUC metric to compare the quality of the models. For example, in A data-driven approach to predicting diabetes and cardiovascular disease with machine learning, the authors worked with a database that was collected over 20 years, containing more than a hundred features. The goal was to predict early stages of CVD, prediabetes and diabetes, and they achieved values of 0.957, 0.802 and 0.839 of area under the curve. In Development and verification of prediction models for preventing cardiovascular diseases, the authors investigated the possibility of different outcomes (death, hospitalization, and others) associated with CVD. The best AUC was 0.96. The Prospects for the Use of Machine Learning Methods for Predicting Cardiovascular Disease (in Russian) explores the possibility of predicting CVD using machine learning methods and some health data. For Accuracy, Precision, Recall and AUC, results were 78%, 0.79, 0.67 and 0.84, respectively.
Conclusion
The considered metrics are basic and work only for classification problem. There are many different areas in which the metrics are different as well, because each task has its own specifics and priorities. It is impossible to give any clear guarantees and state which of the metrics is better; it is worth choosing and giving preference only based on the experience of your own and other researchers.