
Albert Einstein:
"If you can’t explain it to a six-year-old, you probably don’t understand it yourself".
Why Explainable Machine Learning is Necessary
Machine learning models are often considered "black boxes". This does not mean that we cannot get an accurate forecast from them or we cannot clearly explain or understand the logic of their work.
There is no clear mathematical definition of interpretability in machine learning. There are several definitions:
- Interpretability is the degree to which a person can understand the reason for a decision (Miller (2017).
- Interpretability is the degree to which a person can consistently predict the outcome of a model. The higher the interpretability of a machine learning model, the easier it is for someone to understand why certain decisions or predictions were made. A model has better interpretability than another model if its solutions are easier for humans to understand than the solutions of another model.
- Interpretability is the ability to explain its action or show it in a human-readable way.
The model has an impact on subsequent decision-making, for example, in clinical decision support systems (CDDS). Obviously, interpretability will be much more important for CDSS than for models used to predict the outcome of wine classification.
“The problem is that just one metric such as classification accuracy is an insufficient description of most real-world tasks.” Doshi-Velez, Kim, 2017
To understand and interpret how the model operates, we need:
- to define feature importance in the model
- to define the effect of each individual feature on a specific forecast
- to define the impact of each feature on a large number of possible predictions.
Let's take a look at several methods that help to extract these characteristics from the model.
Permutation Importance
What features does the model considers important and what features have the most impact on predictions are parts of the concept of feature importance. Permutation Importance is a technique widely used to calculate feature importance. It helps us to see at what point the model works correctly or produces unexpected results.
Permutation importance is:
- Fast to calculate
- Widely used and understood
- Used in conjunction with commonly applied metrics
Let's say we have a dataset. We want to predict a person's height at age 18 using data that is available at age 12. By performing a random shuffling of a single column, we get the output predictions less accurate, since the received data no longer matches anything in our dataset.
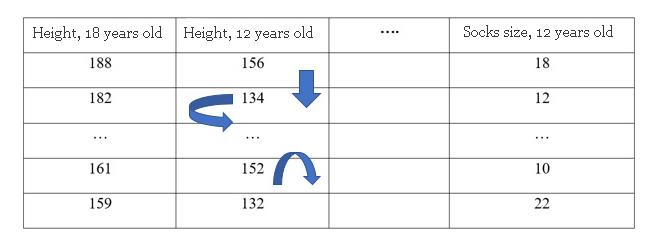
The model's accuracy suffers especially if we shuffle the column that the model relied heavily on for predictions. In this case, the reshuffle of “height at age 12” would generate unpredictable predictions. If, instead, we reshuffled the “socks size at age 12”, the predictions would not have suffered as much.
The process of identifying the feature importance is as follows:
- We get a trained model on "normal" data; we calculate metrics for it, including the value of loss function.
- We shuffle the values in a single column; make predictions using the resulting dataset. We use these predictions and true target values to calculate how much the loss function suffered from shuffling. That performance deterioration measures the importance of the variable that was just shuffled.
- Return the data to its original order (undo the shuffle from step 2) and then repeat step 2 with the next column in the dataset, until the importance of each column is calculated.
There are several libraries for calculating permutation importance; we will consider examples of working with them.
SkLearn
SkLearn is the most common choice for solving classical machine learning problems. Classes in a module sklearn.feature_selection (https://scikit-learn.org/stable/modules/feature_selection.html#rfe) can be used for feature selection/dimensionality reduction on sample sets, either to improve estimators’ accuracy scores or to boost their performance on very high-dimensional datasets.
Thus, the SkLearn library and the recursive feature selection method were used in a model for predicting the occurrence of lower limb amputation in patients with type 2 diabetes over 5 years. Initially, 99 possible features of objective and laboratory data of patients with type 2 diabetes were used. Using this method, a different number of N features and their influence on the prediction accuracy were estimated. As a result, only 20 features were selected (triglycerides, drug intake: peripheral alpha-blockers, sulfonylureas, alpha-glucosidase inhibitors, cholesterol absorption inhibitors, oral anticoagulants, increased microalbuminuria or macroalbuminuria within the last 2 years, LVH by ECG or echocardiogram in the last 2 years, smoking, presence of retinopathy), using which the model achieves the highest AUC = 0.809.
ELI5
ELI5 is another Python library that allows you to visualize various machine learning models using unified API (https://github.com/TeamHG-Memex/eli5). It has built-in support for several ML frameworks and provides ways to interpret the black-box model.
Let’s consider a model that predicts how good a soccer team plays and whether it will be able to guess the “Man of the Game” award or not, based on certain parameters.
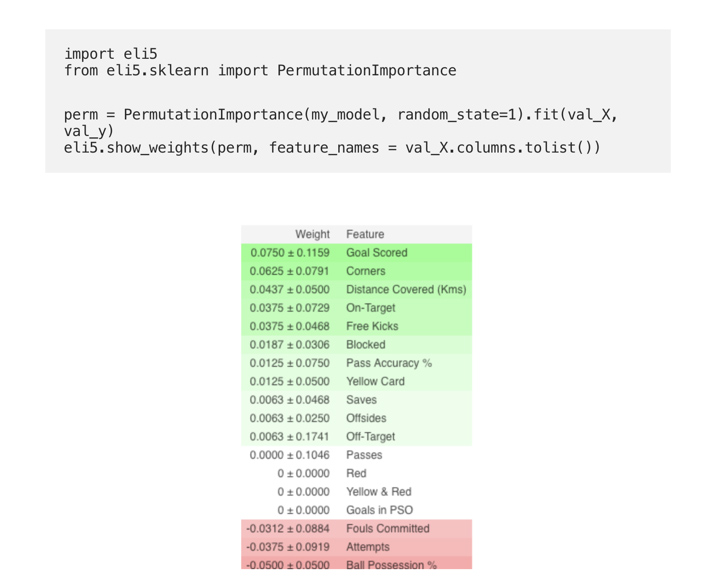
(Here val_X,val_y indicate respectively validation sets)
Visualizations are used to detect features or targets that might affect the subsequent fit.
The following example examines the Rank1D and Rank2D functions for evaluating individual functions and pairs of functions using various metrics that evaluate functions on a scale of [-1, 1] or [0, 1].
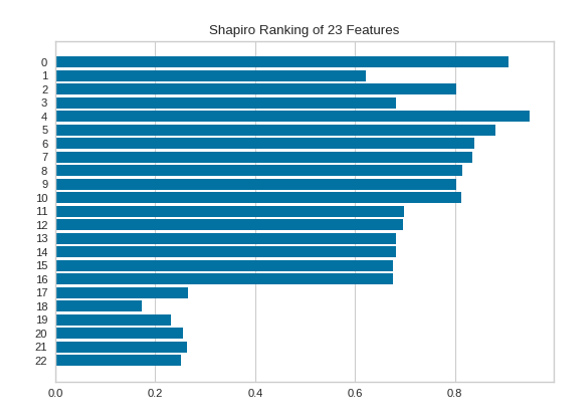
The one-dimensional ranking of [Rank1D] functions uses a ranking algorithm that takes into account only one function at a time.
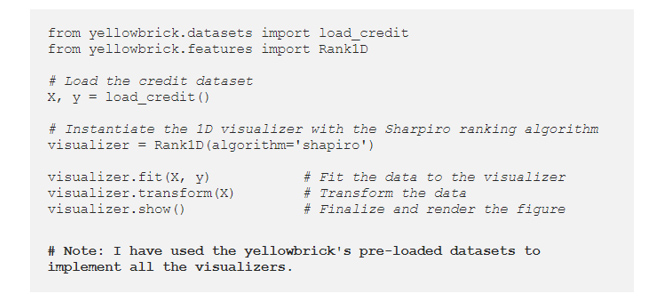
The importance of each of the 23 features is shown in the following figure, the larger the value, the larger the feature importance.
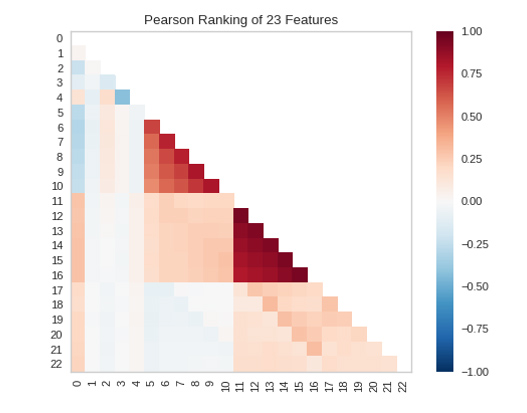
The two-dimensional ranking of functions [Rank 2D] uses an algorithm that simultaneously takes into account pairs of functions. For this, it is convenient to use Pearson correlation, which shows the relationship between two features. The higher the number, the stronger the correlations of the features.
Partial Dependence Plots – PDP
A partial dependence plot (PDP or PD plot) shows the edge effect of one or two features on the predicted outcome of a machine learning model (J. H. Friedman 2001). A partial dependence plot can show whether the relationship between target and feature is linear, monotonic, or more complex. For example, when applied to a linear regression model, partial dependence plots always show a linear relationship.
For classification where the machine learning model outputs probabilities, the partial dependence plot displays the for a certain class given different values for feature(s). An easy way to deal with multiple classes is to draw one line or plot per class. The partial dependence plot is a global method: The method considers all instances and gives a statement about the global relationship of a feature with the predicted outcome.
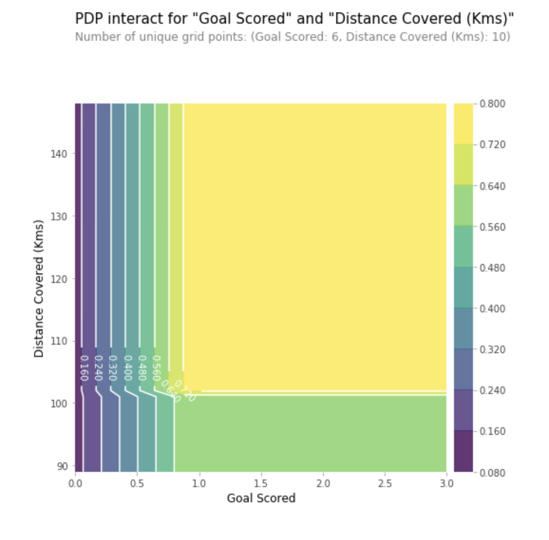
In this graph, the y-axis represents the change in the forecast due to what was predicted at the baseline or left-most value. The blue area indicates the confidence interval. In the x-axis, "Goal Scored" we see that a scored goal increases the likelihood of receiving the ‘Best Player’ award, but after a while saturation occurs.
SHAP
SHAP (SHapley Additive explanation) is the method to break the forecast into parts in order to reveal the value of each feature. It is based on Shapley Values, a principle used in game theory to determine how much each player contributes to a successful game when played together. (https://medium.com/civis-analytics/demystifying-black-box-models-with-shap-value-analysis-3e20b536fc80).
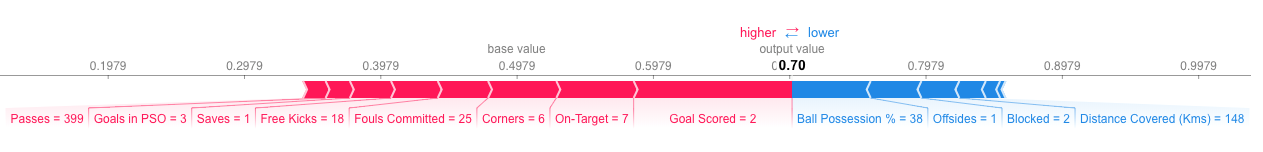
In SHAP the values show how much a given particular trait has changed the prediction compared to the base value of this trait. Let's say we wanted to know what the prediction would be if the team scored 3 goals instead of a fixed base number.
Features that advance the prediction are shown in red, and those that reduce its accuracy are shown in blue.
Aggregating multiple SHAP values will help you to get a more detailed view of your model. To get an idea of which features are most important to the model, we can plot SHAP values for each feature and for each sample. The summary graph shows which features are most important, as well as their range of influence on the dataset.
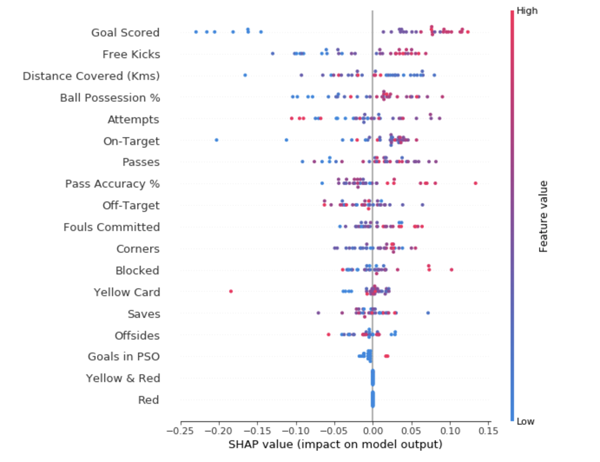
For each point, the color indicates whether the object is of high or low importance for that dataset row; The horizontal arrangement shows whether the influence of the value of this attribute led to a more accurate forecast or not.
The values towards the top are the most important features and those towards the bottom matter least.
The first number in each row shows how much model performance decreased with a random shuffling (in this case, using accuracy as the performance metric). There is some randomness to the exact performance change from shuffling a column. We measure the amount of randomness in our permutation importance calculation by repeating the process with multiple shuffles. The number after the ± measures how performance varied from one-reshuffling to the next. You'll occasionally see negative values for permutation importances. In those cases, the predictions on the shuffled (or noisy) data happened to be more accurate than the real data. This happens when the feature didn't matter (should have had importance close to 0), but random chance caused the predictions on shuffled data to be more accurate. This is more common with small datasets, like the one in this example, because there is more room for luck/chance. Some weights are negative. This is because, in these cases, the shuffled data predictions turned out to be more accurate than the actual data.
Yellowbrick
Yellowbrick (https://www.scikit-yb.org/en/latest/) is designed for feature visualization and extends the Scikit-Learn API to make a model selection and hyperparameter tuning easier. Under the hood, it’s using Matplotlib.
LIME
LIME (local interpretable model-agnostic explanations) is a Python library, which tries to find an interpretable model by providing accurate local explanations (https://github.com/marcotcr/lime).
Lime supports explanations for individual predictions from a wide range of classifiers, and support for scikit-learn is built in.
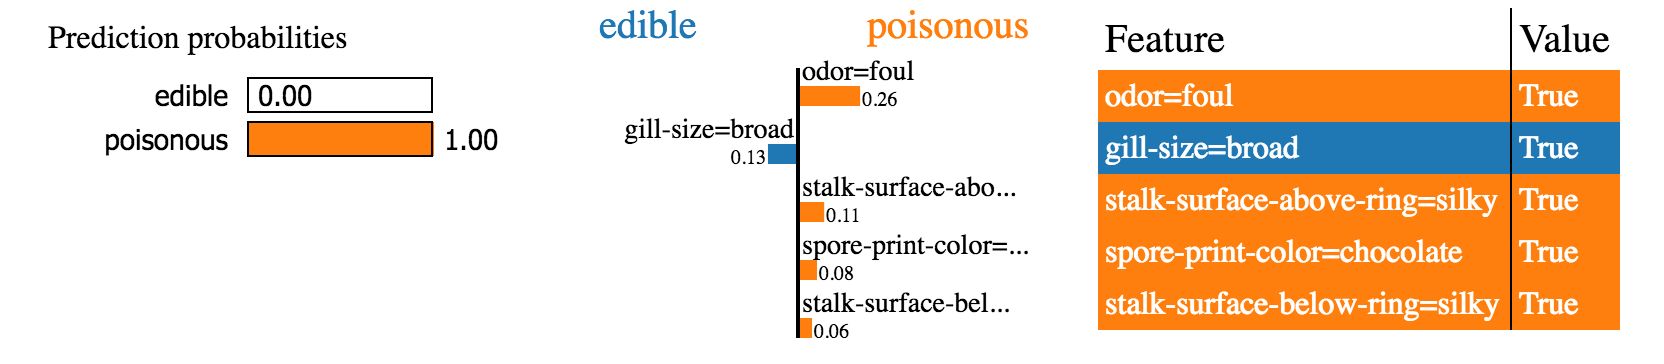
Below is an example of one such explanation for the text classification problem.
The LIME output is a list of explanations that reflect the contribution of each function to the prediction of the data sample. This provides local interpretability and allows you to determine which changes in characteristics will have the greatest impact on the prediction.
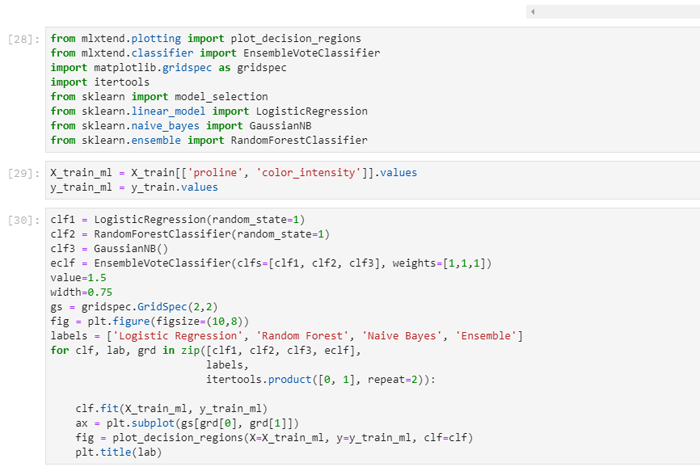
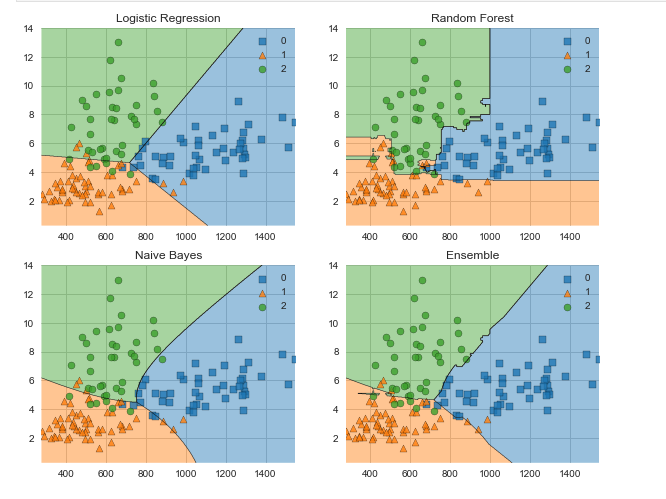
MXLtend
MLxtend library contains a host of helper functions for machine learning This covers things like stacking and voting classifiers, model evaluation, feature extraction and engineering and plotting. Let’s use MLxtend to compare the decision boundaries for a voting classifier against its constituent classifiers.
Conclusion
The interpretability of the model is as important as the quality of the model. In order to gain acceptance, it is necessary for machine learning systems to provide clear explanations for their decisions. The main Python libraries for model interpretation are presented, which are used by the specialists of the K-SkAI company when creating models of predictive analytics and risk management in healthcare.
Sources:
- Rebecca Vickery. Python Libraries for Interpretable Machine Learning https://towardsdatascience.com/python-libraries-for-interpretable-machine-learning-c476a08ed2c7
- «Interpretable Machine Learning: A Guide for Making Black Box Models Explainable» Christoph Molnar
- Machine Learning Explainability Micro Course on Kaggle
- OTUS. Online education. Interpretable machine learning model. Part 2. (in Russian) https://habr.com/en/company/otus/blog/465329/.